 by
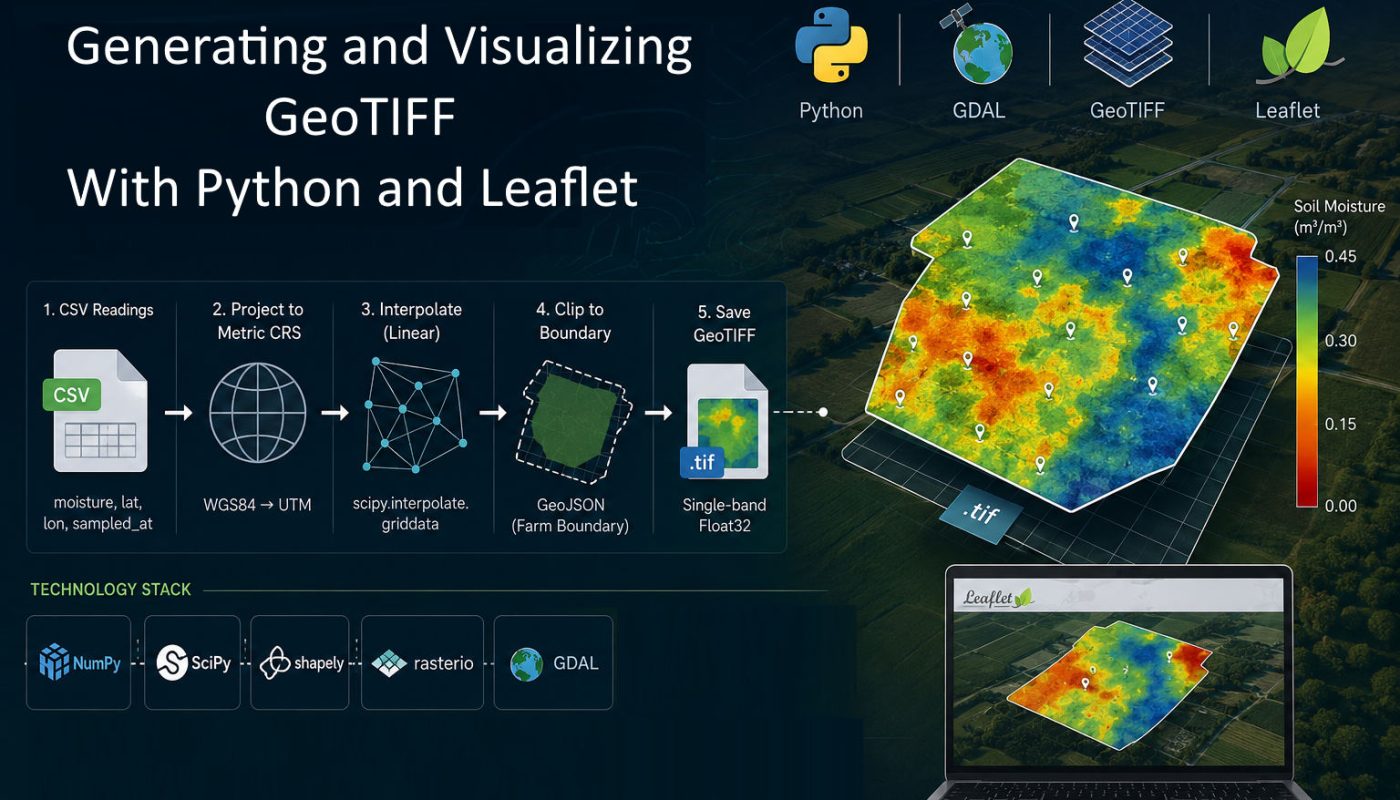
by Assume we have a collection of soil-moisture measurements from a farm. Each measurement has a decimal moisture value, latitude, longitude, and sample time. We want to visualize these values on the map to help the farmer better understand the moisture level of different areas of the farm:
moisture,latitude,longitude,sampled_at
0.1000,50.451201,30.501118,2026-06-11T08:00:00Z
0.8100,50.451802,30.502045,2026-06-11T08:01:00Z
0.1842,50.452118,30.500752,2026-06-11T08:02:00Z
To display farm soil moisture level on map we need to turn those point measurements into a single-band GeoTIFF. At the final step of this post we will have GeoTIFF visualization on the map using leaflet like this :
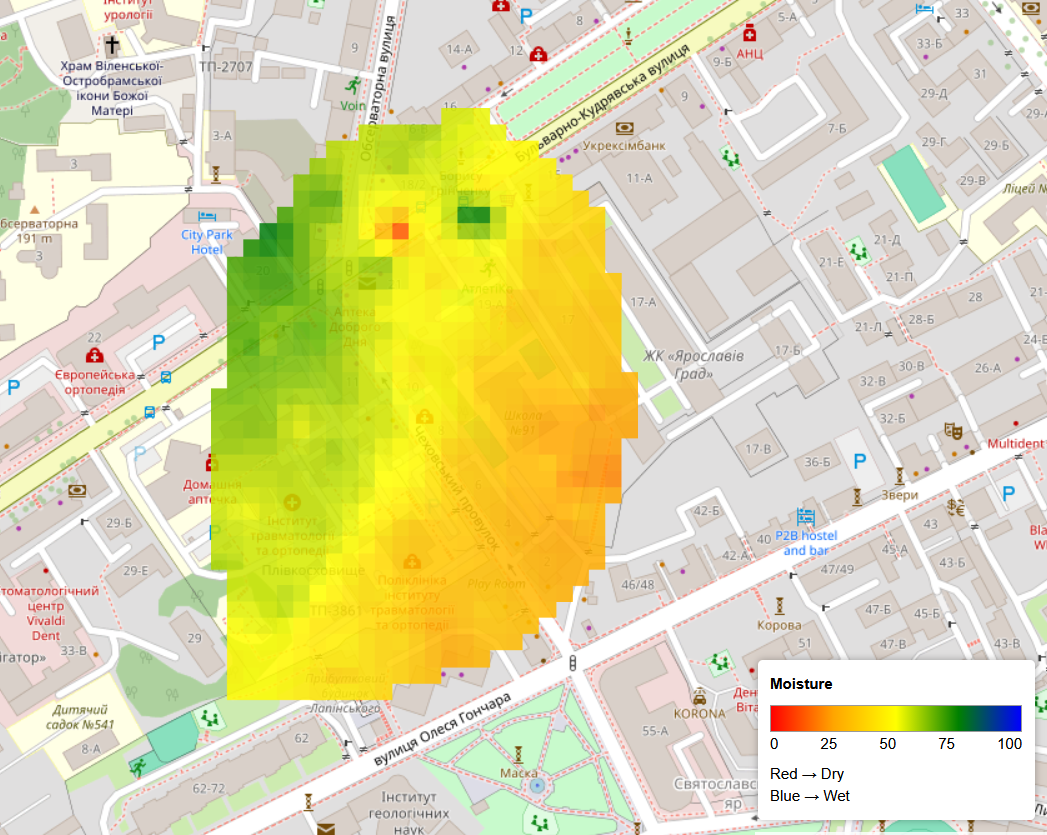
The only issue with this example is that the latitude and longitude values were randomly generated, so the sample farm happens to appear inside an urban area😅. You can think of it as a farm area.
What you will read in this post is:
Also, here’s the GitHub repo for the full GeoTIFF-Generator project: https://github.com/birddevelper/GeoTIFF-Generator
Generating GeoTIFF from CSV file data
Assume our CSV file has these columns:
moisture: decimal value, usually0.10to0.81in the sample datalatitude: WGS84 latitudelongitude: WGS84 longitudesampled_at: ISO timestamp
The output GeoTIFF would be a single-band byte raster. I choosed single band beacause it’s compact, easy to render in a browser, and still useful in GIS tools. Let’s start implementation:
The Entry Point
In the main function of make_geotiff.py (our main module) we get user arguments and create a RasterConfig, and generates the GeoTIFF using make_geotiff function. I’ll explain the make_geotiff in later sections:
from __future__ import annotations

import argparse
from pathlib import Path

from core import RasterConfig


def default_output_dir() -> Path:
    return Path(__file__).resolve().parent / "output"


def build_parser() -> argparse.ArgumentParser:
    parser = argparse.ArgumentParser(
        description="Generate a single-band GeoTIFF from a moisture CSV file."
    )
    parser.add_argument("csv_path", type=Path, help="Path to the input CSV file.")
    parser.add_argument(
        "--boundary-geojson",
        dest="boundary_geojson_path",
        type=Path,
        required=True,
        help="Path to a GeoJSON file containing the farm boundary polygon.",
    )
    parser.add_argument(
        "-o",
        "--output",
        type=Path,
        default=default_output_dir(),
        help="Output directory or GeoTIFF file path. Defaults to the package output folder.",
    )
    parser.add_argument(
        "--resolution-m",
        type=float,
        default=10.0,
        help="Approximate raster resolution in meters.",
    )
    parser.add_argument(
        "--max-distance-m",
        type=float,
        default=None,
        help="Optional maximum distance from a sensor point before a pixel is marked NoData.",
    )
    parser.add_argument(
        "--nodata",
        type=int,
        default=255,
        help="NoData byte value to write into the GeoTIFF. Must be 101-255.",
    )
    return parser


def main(argv: list[str] | None = None) -> int:
    parser = build_parser()
    args = parser.parse_args(argv)

    from pipeline import make_geotiff

    config = RasterConfig(
        resolution_m=args.resolution_m,
        max_distance_m=args.max_distance_m,
        nodata_value=args.nodata,
    )
    output_path = make_geotiff(
        args.csv_path, args.boundary_geojson_path, args.output, config
    )
    print(f"GeoTIFF written to: {output_path}")
    return 0


if __name__ == "__main__":
    raise SystemExit(main())
In the code above, the RasterConfig holds the GeoTIFF generation settings: pixel resolution, optional max interpolation distance, and NoData byte value.
Core Data And Input Loading
In core.py we declare data classes and input parsers.
from __future__ import annotations

import csv
import json
from dataclasses import dataclass
from datetime import datetime
from pathlib import Path


@dataclass(frozen=True)
class MoistureReading:
    moisture: float
    latitude: float
    longitude: float
    sampled_at: datetime


@dataclass(frozen=True)
class RasterConfig:
    resolution_m: float = 10.0
    max_distance_m: float | None = None
    nodata_value: int = 255
MoistureReading data class stores one measured point, and RasterConfig stores output settings, we created one instance of it in main function in make_geotiff.py .
def _parse_sampled_at(value: str) -> datetime:
    return datetime.fromisoformat(value.strip().replace("Z", "+00:00"))


def read_moisture_csv(csv_path: Path) -> list[MoistureReading]:
    if not csv_path.exists():
        raise FileNotFoundError(f"CSV file does not exist: {csv_path}")

    readings: list[MoistureReading] = []
    with csv_path.open("r", encoding="utf-8", newline="") as file:
        reader = csv.DictReader(file)
        required_columns = {"moisture", "latitude", "longitude", "sampled_at"}
        missing_columns = required_columns.difference(reader.fieldnames or [])
        if missing_columns:
            raise ValueError(f"CSV file is missing required columns: {sorted(missing_columns)}")

        for row in reader:
            moisture_raw = (row.get("moisture") or "").strip()
            latitude_raw = (row.get("latitude") or "").strip()
            longitude_raw = (row.get("longitude") or "").strip()
            sampled_at_raw = (row.get("sampled_at") or "").strip()

            if not moisture_raw or not latitude_raw or not longitude_raw or not sampled_at_raw:
                continue

            readings.append(
                MoistureReading(
                    moisture=float(moisture_raw),
                    latitude=float(latitude_raw),
                    longitude=float(longitude_raw),
                    sampled_at=_parse_sampled_at(sampled_at_raw),
                )
            )

    return readings
_parse_sampled_at() parses ISO timestamps and supports Z. read_moisture_csv() validates required columns and returns typed readings.
def _extract_geojson_geometry(data: object) -> dict:
    if not isinstance(data, dict):
        raise ValueError("Invalid GeoJSON content.")

    geometry_type = data.get("type")
    if geometry_type == "FeatureCollection":
        features = data.get("features") or []
        if not features:
            raise ValueError("GeoJSON FeatureCollection does not contain any features.")
        return _extract_geojson_geometry(features[0])

    if geometry_type == "Feature":
        geometry = data.get("geometry")
        if geometry is None:
            raise ValueError("GeoJSON Feature does not contain a geometry.")
        return geometry

    return data


def load_boundary_geojson(geojson_path: Path):
    if not geojson_path.exists():
        raise FileNotFoundError(f"Boundary GeoJSON file does not exist: {geojson_path}")

    from shapely.geometry import MultiPolygon, Polygon, shape

    with geojson_path.open("r", encoding="utf-8") as file:
        data = json.load(file)

    geometry = _extract_geojson_geometry(data)
    polygon = shape(geometry)

    if polygon.is_empty:
        raise ValueError(f"Boundary GeoJSON is empty: {geojson_path}")

    if isinstance(polygon, MultiPolygon):
        polygon = max(polygon.geoms, key=lambda geom: geom.area)

    if not isinstance(polygon, Polygon):
        raise ValueError("Boundary GeoJSON must describe a Polygon or MultiPolygon.")

    return polygon
_extract_geojson_geometry() normalizes different valid GeoJSON shapes into one plain geometry object. If the input is a FeatureCollection, it takes the first feature; if it is a Feature, it extracts its geometry; if it is already a raw geometry like Polygon or MultiPolygon, it returns it unchanged. Its output is the geometry dictionary that Shapely can convert into a polygon for clipping the raster. load_boundary_geojson() reads the boundary GeoJSON file using _extract_geojson_geometry(), extracts its geometry, converts it into a Shapely shape, validates that it is not empty, and ensures the result is a usable farm boundary polygon. For simplicity, if the GeoJSON contains a MultiPolygon, it keeps the largest polygon. Its output is a Shapely Polygon, which the raster step uses to mask pixels outside the farm boundary as NoData.
Raster Generation
In raster.py we convert point measurements into a georeferenced raster. A raster is a grid of pixels or cells where each cell stores a value. For a moisture GeoTIFF, the raster is like a spreadsheet laid over the farm. The raster remains in EPSG:4326, but interpolation and distance filtering operations need meter-like distances. The code approximates meters per degree at the farm latitude.
from __future__ import annotations

import math
from dataclasses import dataclass
from pathlib import Path

import numpy as np
from osgeo import gdal, osr
from scipy.spatial import cKDTree
from core import MoistureReading

def meters_per_degree(latitude: float) -> tuple[float, float]:
    latitude_radians = math.radians(latitude)
    meters_per_degree_latitude = (
        111132.92
        - 559.82 * math.cos(2 * latitude_radians)
        + 1.175 * math.cos(4 * latitude_radians)
        - 0.0023 * math.cos(6 * latitude_radians)
    )
    meters_per_degree_longitude = (
        111412.84 * math.cos(latitude_radians)
        - 93.5 * math.cos(3 * latitude_radians)
        + 0.118 * math.cos(5 * latitude_radians)
    )
    return meters_per_degree_latitude, meters_per_degree_longitude


def to_metric_xy(
    longitudes: np.ndarray,
    latitudes: np.ndarray,
    reference_latitude: float,
) -> tuple[np.ndarray, np.ndarray]:
    meters_lat, meters_lon = meters_per_degree(reference_latitude)
    x_coords = np.asarray(longitudes, dtype=np.float64) * meters_lon
    y_coords = np.asarray(latitudes, dtype=np.float64) * meters_lat
    return x_coords, y_coords


def degree_steps_for_resolution(resolution_m: float, reference_latitude: float) -> tuple[float, float]:
    meters_lat, meters_lon = meters_per_degree(reference_latitude)
    lon_step = resolution_m / meters_lon
    lat_step = resolution_m / meters_lat
    return lon_step, lat_step
meters_per_degree() estimates latitude and longitude scale at a reference latitude. to_metric_xy() converts lon/lat arrays into approximate meter coordinates, and degree_steps_for_resolution() converts requested meter resolution into lon/lat pixel steps.
Grid Definition
@dataclass(frozen=True)
class GridSpec:
    width: int
    height: int
    lon_step: float
    lat_step: float
    geotransform: tuple[float, float, float, float, float, float]
    lon_grid: np.ndarray
    lat_grid: np.ndarray
    reference_latitude: float


def build_grid(
    bounds: tuple[float, float, float, float],
    resolution_m: float,
    reference_latitude: float,
) -> GridSpec:
    min_lon, min_lat, max_lon, max_lat = bounds
    lon_step, lat_step = degree_steps_for_resolution(resolution_m, reference_latitude)

    width = max(1, int(math.ceil((max_lon - min_lon) / lon_step)))
    height = max(1, int(math.ceil((max_lat - min_lat) / lat_step)))

    lon_centers = min_lon + (np.arange(width) + 0.5) * lon_step
    lat_centers = max_lat - (np.arange(height) + 0.5) * lat_step
    lon_grid, lat_grid = np.meshgrid(lon_centers, lat_centers)
    geotransform = (min_lon, lon_step, 0.0, max_lat, 0.0, -lat_step)

    return GridSpec(
        width=width,
        height=height,
        lon_step=lon_step,
        lat_step=lat_step,
        geotransform=geotransform,
        lon_grid=lon_grid,
        lat_grid=lat_grid,
        reference_latitude=reference_latitude,
    )
GridSpec keeps raster size, pixel centers, and GDAL geotransform together. build_grid() creates a lon/lat grid over the farm boundary bounds. It creates the empty raster grid that the moisture values will be written into. It takes the farm boundary bounds, the desired pixel size, like 10 meters, a reference latitude for meter-to-degree conversion, then it converts the requested meter resolution into longitude/latitude steps, and calculates how many columns and rows the raster needs. Then, it creates longitude and latitude coordinates for each pixel center, and builds lon_grid and lat_grid, which represent every raster cell location. Finally it creates the GDAL geotransform, which tells GIS tools where the raster sits on Earth.
Continuous Moisture Surface
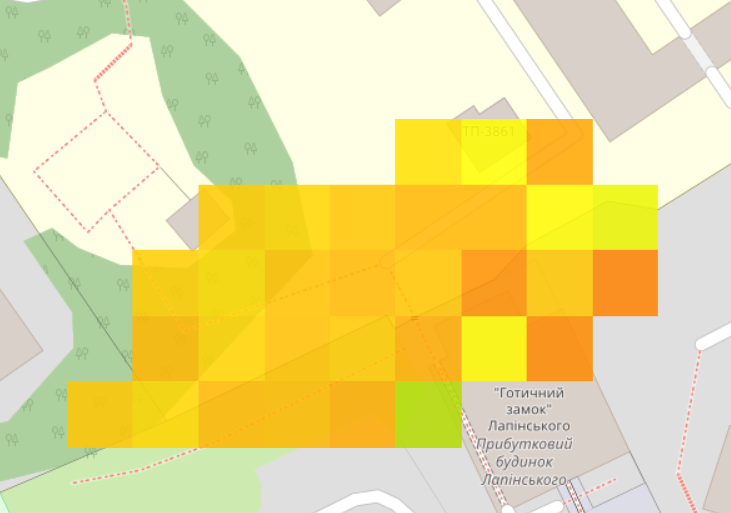
For interpolation we use inverse-distance weighting. Each raster cell queries nearby sample points with cKDTree; closer samples receive higher weights. This way we will have smooth transation between tails in moisture visulization instead of disecret tiles.
def interpolate_moisture(
    readings: list[MoistureReading],
    grid: GridSpec,
    *,
    neighbors: int = 12,
    power: float = 2.0,
    smoothing: float = 1e-9,
) -> np.ndarray:
    longitudes = np.array([reading.longitude for reading in readings], dtype=np.float64)
    latitudes = np.array([reading.latitude for reading in readings], dtype=np.float64)
    moisture = np.array([reading.moisture for reading in readings], dtype=np.float64)

    point_x, point_y = to_metric_xy(longitudes, latitudes, grid.reference_latitude)
    grid_x, grid_y = to_metric_xy(grid.lon_grid.ravel(), grid.lat_grid.ravel(), grid.reference_latitude)

    query_points = np.column_stack([grid_x, grid_y])
    sample_points = np.column_stack([point_x, point_y])
    tree = cKDTree(sample_points)

    k = min(max(1, neighbors), len(readings))
    distances, indices = tree.query(query_points, k=k)
    distances = np.asarray(distances, dtype=np.float64)
    indices = np.asarray(indices)

    if k == 1:
        surface = moisture[indices]
        return surface.reshape(grid.lon_grid.shape).astype(np.float32)

    exact_matches = distances <= smoothing
    weights = 1.0 / np.power(distances + smoothing, power)
    weighted_moisture = moisture[indices] * weights
    weighted_sum = weighted_moisture.sum(axis=1)
    weight_total = weights.sum(axis=1)
    surface = np.divide(
        weighted_sum,
        weight_total,
        out=np.zeros_like(weighted_sum),
        where=weight_total > 0,
    )

    if np.any(exact_matches):
        exact_rows = np.where(np.any(exact_matches, axis=1))[0]
        exact_cols = np.argmax(exact_matches[exact_rows], axis=1)
        surface[exact_rows] = moisture[indices[exact_rows, exact_cols]]

    return surface.reshape(grid.lon_grid.shape).astype(np.float32)
Function summary:
interpolate_moisture()creates a continuous decimal moisture grid.neighborslimits how many sample points affect each cell.powercontrols how quickly influence drops with distance.smoothingprevents division by zero and supports exact point matches.
Boundary And Distance Masks
Displaying moisture levels outside the farm boundary is undesirable, so we need to clip the map to the farm’s perimeter. The farm boundary is available from a GeoJSON file provided via command-line arguments.
def clip_to_boundary(grid_values: np.ndarray, grid: GridSpec, boundary_polygon) -> np.ndarray:
    from shapely import contains_xy

    mask = contains_xy(boundary_polygon, grid.lon_grid, grid.lat_grid)
    clipped = np.array(grid_values, copy=True)
    clipped[~mask] = np.nan
    return clipped


def limit_by_distance(
    readings: list[MoistureReading],
    grid_values: np.ndarray,
    grid: GridSpec,
    max_distance_m: float,
) -> np.ndarray:
    point_lons = np.array([reading.longitude for reading in readings], dtype=np.float64)
    point_lats = np.array([reading.latitude for reading in readings], dtype=np.float64)
    point_x, point_y = to_metric_xy(point_lons, point_lats, grid.reference_latitude)

    grid_x, grid_y = to_metric_xy(grid.lon_grid.ravel(), grid.lat_grid.ravel(), grid.reference_latitude)
    tree = cKDTree(np.column_stack([point_x, point_y]))
    distances, _ = tree.query(np.column_stack([grid_x, grid_y]))

    limited = np.array(grid_values, copy=True).ravel()
    limited[distances > max_distance_m] = np.nan
    return limited.reshape(grid_values.shape)
In the code above, the clip_to_boundary() sets cells outside the farm polygon to np.nan, and limit_by_distance() optionally sets cells too far from samples to np.nan. For example, if the nearest sample point is 80 meters away and you set –max-distance-m 30, that cell becomes np.nan (NoData) in the GeoTIFF.
GeoTIFF Writer
The writer converts decimal moisture to byte percent values. GDAL writes the raster as GDT_Byte.
def write_single_band_geotiff(
    output_path: Path,
    grid_values: np.ndarray,
    grid: GridSpec,
    nodata_value: int,
) -> Path:
    if not 101 <= nodata_value <= 255:
        raise ValueError("UInt8 GeoTIFF NoData value must be between 101 and 255.")

    output_path.parent.mkdir(parents=True, exist_ok=True)

    driver = gdal.GetDriverByName("GTiff")
    dataset = driver.Create(
        str(output_path),
        grid.width,
        grid.height,
        1,
        gdal.GDT_Byte,
        options=["COMPRESS=LZW"],
    )
    if dataset is None:
        raise RuntimeError(f"Could not create GeoTIFF at {output_path}")

    dataset.SetGeoTransform(grid.geotransform)
    spatial_reference = osr.SpatialReference()
    spatial_reference.ImportFromEPSG(4326)
    dataset.SetProjection(spatial_reference.ExportToWkt())

    band = dataset.GetRasterBand(1)
    band.SetNoDataValue(nodata_value)

    percent_values = np.where(
        np.isfinite(grid_values),
        np.rint(np.clip(grid_values * 100.0, 0.0, 100.0)),
        nodata_value,
    ).astype(np.uint8)
    band.WriteRaster(
        0,
        0,
        grid.width,
        grid.height,
        percent_values.tobytes(order="C"),
        buf_xsize=grid.width,
        buf_ysize=grid.height,
        buf_type=gdal.GDT_Byte,
    )
    band.FlushCache()

    dataset.FlushCache()
    dataset = None
    return output_path
write_single_band_geotiff()writes oneUInt8band with LZW compression.- Valid decimal moisture is scaled by
* 100, rounded, and clipped to0..100. - Missing cells become
nodata_value, normally255. WriteRaster()avoids requiring GDAL’sgdal_arrayextension.
Pipeline
Finally, pipeline.py connects all pieces.
from __future__ import annotations

from pathlib import Path

from core import RasterConfig, load_boundary_geojson, read_moisture_csv
from raster import build_grid, clip_to_boundary, interpolate_moisture, limit_by_distance, write_single_band_geotiff


def default_output_dir() -> Path:
    return Path(__file__).resolve().parent / "output"


def resolve_output_path(csv_path: Path, output_target: Path | None) -> Path:
    if output_target is None:
        return default_output_dir() / f"{csv_path.stem}_moisture.tif"

    if output_target.suffix.lower() in {".tif", ".tiff"}:
        return output_target

    return output_target / f"{csv_path.stem}_moisture.tif"


def make_geotiff(
    csv_path: Path,
    boundary_geojson_path: Path,
    output_target: Path | None = None,
    config: RasterConfig | None = None,
) -> Path:
    job_config = config or RasterConfig()
    readings = read_moisture_csv(csv_path)
    if not readings:
        raise ValueError("No valid moisture readings were found in the CSV file.")

    boundary = load_boundary_geojson(boundary_geojson_path)
    reference_latitude = float(sum(reading.latitude for reading in readings) / len(readings))

    grid = build_grid(boundary.bounds, job_config.resolution_m, reference_latitude)
    interpolated = interpolate_moisture(readings, grid)
    clipped = clip_to_boundary(interpolated, grid, boundary)

    if job_config.max_distance_m is not None:
        clipped = limit_by_distance(readings, clipped, grid, job_config.max_distance_m)

    output_path = resolve_output_path(csv_path, output_target)
    return write_single_band_geotiff(output_path, clipped, grid, job_config.nodata_value)
make_geotiff() is the main pipeline function that turns the input CSV and farm boundary GeoJSON into the final GeoTIFF file. To sum up the flow, the generation order is like following:
- read CSV
- load boundary
- compute average latitude for meter conversion
- build grid
- interpolate moisture
- clip to boundary
- optionally apply max-distance mask
- write GeoTIFF
To generate GeoTIFF, run the make_geotiff.py like this:
python make_geotiff.py input/farm_moisture_200.csv --boundary-geojson input/farm_boundary.geojson
Displaying the GeoTIFF on map using leaflet
The GeoTIFF stays single-band. So in the browser we read its pixel value and maps it to a color.
HTML
<!DOCTYPE html>
<html lang="en">
<head>
  <meta charset="UTF-8" />
  <meta name="viewport" content="width=device-width, initial-scale=1.0" />
  <title>Farm Moisture Map</title>
  <link rel="stylesheet" href="https://unpkg.com/leaflet@1.9.4/dist/leaflet.css" />
  <style>
    html, body, #map {
      margin: 0;
      width: 100%;
      height: 100%;
      font-family: Arial, sans-serif;
    }
  </style>
</head>
<body>
  <div id="map"></div>
  <script src="https://unpkg.com/leaflet@1.9.4/dist/leaflet.js"></script>
  <script src="https://unpkg.com/geotiff/dist-browser/geotiff.js"></script>
  <script src="https://cdn.jsdelivr.net/npm/georaster@1.6.0/dist/georaster.browser.bundle.min.js"></script>
  <script src="https://unpkg.com/georaster-layer-for-leaflet/dist/georaster-layer-for-leaflet.min.js"></script>
  <script src="https://unpkg.com/chroma-js@2.4.2/chroma.min.js"></script>
  <script src="app.js"></script>
</body>
</html>
JavaScript
const GEOTIFF_URL = "output/farm_moisture_200_moisture.tif";
const MIN_VALUE = 0;
const MAX_VALUE = 100;

const map = L.map("map", { zoomControl: true }).setView([0, 0], 2);

L.tileLayer("https://tile.openstreetmap.org/{z}/{x}/{y}.png", {
  attribution: "© OpenStreetMap contributors",
  maxZoom: 19,
}).addTo(map);

const moistureScale = chroma
  .scale(["#7b4f2a", "#d9c27d", "#4caf50"])
  .domain([MIN_VALUE, MAX_VALUE]);

async function loadMoistureRaster() {
  try {
    const response = await fetch(GEOTIFF_URL);
    if (!response.ok) {
      throw new Error(`Failed to load GeoTIFF: ${response.status}`);
    }

    const arrayBuffer = await response.arrayBuffer();
    const georaster = await parseGeoraster(arrayBuffer);
    const noData = georaster.noDataValue;

    const rasterLayer = new GeoRasterLayer({
      georaster,
      opacity: 0.85,
      resolution: 256,
      pixelValuesToColorFn: (values) => {
        const moisture = values?.[0];

        if (
          moisture === undefined ||
          moisture === null ||
          Number.isNaN(moisture) ||
          moisture === noData
        ) {
          return undefined;
        }

        const clamped = Math.max(MIN_VALUE, Math.min(MAX_VALUE, moisture));
        return moistureScale(clamped).hex();
      },
    });

    rasterLayer.addTo(map);
    map.fitBounds(rasterLayer.getBounds());
  } catch (error) {
    console.error(error);
    alert("Failed to load GeoTIFF. Check the console for details.");
  }
}

loadMoistureRaster();
In the javascript after we load the GeoTIFF bytes using fetch(), we parse it by parseGeoraster(). Then GeoRasterLayer renders the raster on Leaflet. The pixelValuesToColorFn() function skips NoData and maps 0..100 moisture to a corresponding color. The fitBounds() zooms the map to the raster extent. So when page loads, it automatically zoom in the farm area.
Serve the HTML over a HTTP server like apache, or ngnix, not file://, so the browser can fetch the GeoTIFF and openstreet, otherwise you face CORS error. BTW, you can find source code of the project in this github repository: https://github.com/birddevelper/GeoTIFF-Generator
I hope you found this post helpful. If you enjoyed it or have any questions, leave a comment, I’d love to hear your thoughts.